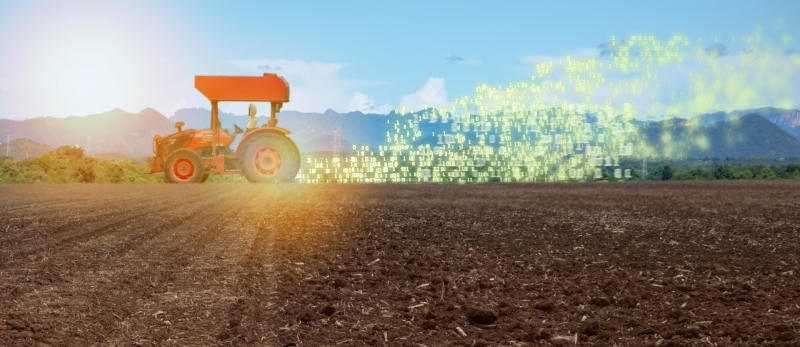
The Hawking project offers new and innovative AI analysis through a satellite platform (Image credit: Monopoly919/Shutterstock)
When SME Hummingbird was created in 2016, it had a clear mission: “Measure sustainability, optimise food production and push the boundaries of science and technology through sophisticated modelling and predictive analytics”. Through ‘Project Hawking’ with its remote sensing platform, Hummingbird is now solving challenges in yield losses, inefficient inputs, unsustainable practices and poor decision making.
Before Project Hawking, Hummingbird Technologies Ltd., an artificial intelligence (AI) business based in London, were identifying crop health issues and forecasting the occurrence of possible diseases and weed pressures in the field by using UAV (unmanned aerial vehicle) imagery processed by its AI algorithms. This imagery was also used to produce variable rate fertiliser and other chemical application maps.
Ingenuity struck with Project Hawking, a collaboration funded and supported by ESA Space Solutions, where Hummingbird started adding satellite observation points throughout the growing season to the process. Hummingbird was now able to build an extensive time series of data to apply its proprietary machine learning techniques..
Project Hawking was launched a few days after the death of Stephen Hawking in March 2018. Hummingbird decided to rename the project in memory of the great scientist. (Image credit: Delcarmat/Shutterstock
The added dimension of satellite data
This deep, new layer of intelligence complemented the existing UAV platform, enabling increased accurately geo-referenced UAV and ground truthed (information gained via direct observation rather than inference) captured imagery during the image acquisition.
“The first step was for Hummingbird to build the system architecture necessary to process satellite data from ESA as well as other higher resolution commercial imagery,” says Olivier Becu, Technical Officer at ESA. “Next they needed to adapt their existing front-end to display the generated high-value information to customers”.
Hummingbird started to train AI algorithms with the thousands of satellite images they collected and matched with existing datasets. The aim was to develop a processing chain delivering satellite-derived vegetation index maps. Data and imagery were collected from the various satellite providers and processed using the platform, with analysis of crop health, yield and rate of change provided. This included vital data such as the identification of disease and disease prevalence as well as soil type mapping by reflectance data.
With Hummingbird’s Crop Identification tool, you can determine the planted area of Canola, Cereals, Pulses and Maize / Soybean in-season. (Image credit: Hummingbird Technologies Ltd.)
With Hummingbird’s Crop Identification tool, you can determine the planted area of Canola, Cereals, Pulses and Maize / Soybean in-season. (Image credit: Hummingbird Technologies Ltd.)“Project Hawking cuts farm costs and improves yields by using satellite data to provide predictions in macro analytics and targeted agro-chemical applications, with the aim of reducing blanket agrochemical input. This reduces the negative environmental effects of agrochemical overuse, promotes responsible stewardship, and reduces the natural resistance build-up in crop diseases,” Alexander Jevons, Hummingbird Technologies Ltd.
In a matter of months, Hummingbird was set up with multiple satellite data sources delivering timely optical measurements and radar data at various geographical resolutions. Over the course of 2019, Hummingbird made its AI/satellite derived maps available to a set of trial users as part of a pilot project. This project involved large farm management company Velcourt and Cranfield University for scientific support.
The fruit of this pilot was a freemium satellite offering that gives users access to basic satellite analysis with the ability to upsell higher resolution analysis where needed. By the end of 2019, more than 5000 farmers across the world had requested access to the data. Many of these farmers have now subscribed to the commercially available Hawking service.
For almost all of the stages of crop development, Hummingbird can support the farmers to achieve more with less: seeding, fertilising, treating and forecasting yield for all major crops. Hummingbird has now launched commercial operations in Ukraine and Russia, Australia, Brazil and North America.
“As a result of Project Hawking and ESA funding Hummingbird has conducted a successful raise of £8.2m and grown the company to over 60 people globally with three international subsidiaries,” Alexander Jevons, Hummingbird Technologies Ltd.
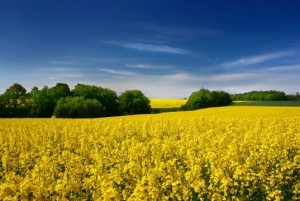
A particular highlight of the project is the Green Area Index canopy management tool for Oil seed Rape. This cutting-edge innovation was built and trained using UAV data and then cross calibrated to run on satellite data. The tool delivers uniquely accurate canopy management recommendations and represents a breakthrough for Oilseed Rape cultivators. (Image credit: KellySHUTSTOC/Shutterstock.)
ESA Space Solutions
ESA Space Solutions aims at reaching commercial exploitation of space assets, data and capabilities addressing incubation, proving technical feasibility and business development. This includes the development of operational services for a wide range of users through the combination of different systems, and support in creating viable companies as well as to existing companies.
Our CEO and Founder Will Wells, was recently interviewed by Hannah MacInnes on The Klosters Forum Feed & Flourish Podcast series, to discuss the topic of biodiversity and ways in which we can transform our food systems in order to positively preserve our planet.
As a business, we are 100% committed to creating sustainable food sources by using technology whilst ensuring the agricultural community can maintain higher yields.
Will discusses how Biodiversity is directly likened with soil health, and that to achieve this you need to grow different types of crop together to combine that with trees and livestock, along with how technology can help solve the mismatch that occurs in the supply chain when farmers are trying to meet those needs.
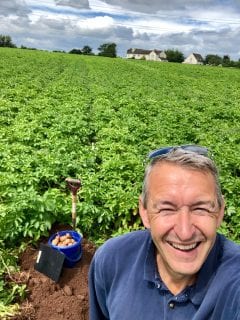
If you stand at the edge of a potato field, you’ll only see a small sampling of plants. If you start walking across it, you’ll be slowed by the potato hills. Overall, it’s not the easiest process. Drones and satellites however can see the whole field, which is what Hummingbird Technologies is using to help potato growers monitor their fields.
“It’s fair to say it’s early days, but not many other businesses are offering this type of tool that we’re aware of,” Jeff Goulding, Hummingbird’s United Kingdom business development manager, says in a Google Hangouts interview. “I think the market is fairly open… precision farming in potatoes is a new area.”
The UK—based precision agriculture company launched in Canada in January and offers a full slate of products for various crops including potatoes. Hummingbird collects information about fields from drones and satellites, the information is then presented through their web and ap-based platforms to growers who can integrate the information with other technology on their machinery.
Precision agriculture products have been gaining in popularity over the last decade with many start-ups launching and larger companies developing their own products. The products are designed to save producers time and money by monitoring their crops remotely, but also give industry a better understanding of how crops are doing and assist agronomists in their work.
“We’re not looking to replace agronomists. In many ways’ agronomists are irreplaceable, but we’re looking to support their role and make them more efficient,” Goulding says.
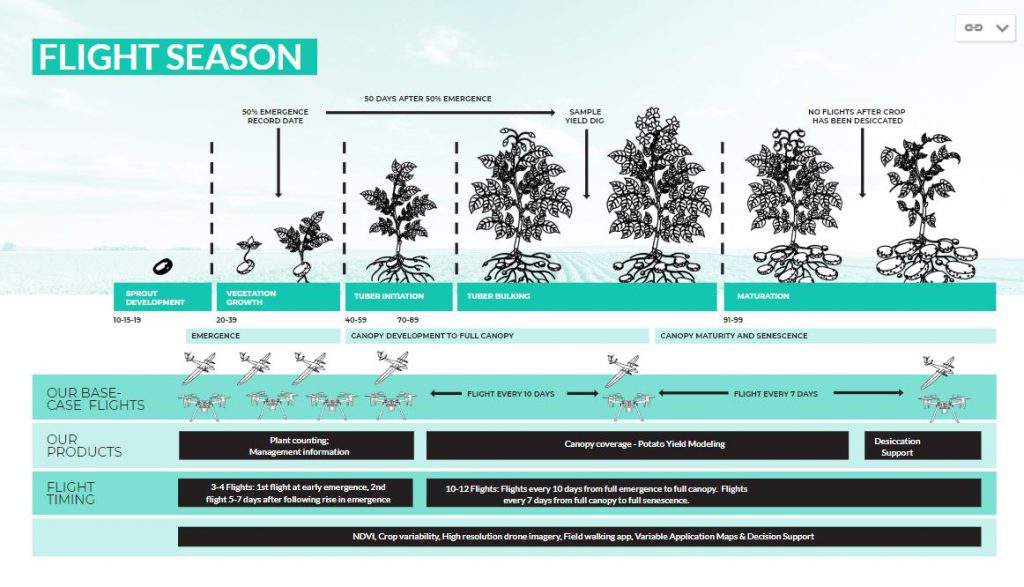
Potato Products
The potato precision agriculture world is lacking compared to its commodity crop peers like wheat who have numerous options — which gives Hummingbird an edge. The ag tech company may be new to Canada, but UK farmers have been using its products for a few years now.
One of the products they offer is potato plant counting. When the plate is around of five- or six-inches tall Hummingbird will fly a drone over the field and count every single emerged plant. This can help growers to see how effective a fungicide treatment has been or if they are having any planter problems.
“Farmers will typically know how many tubers per acre they’ve planted almost to the exact number, but they will not know how many tubers have emerged. And if there’s a huge difference then there is an issue that needs to be addressed,” Goulding explains.
They can also measure canopy development by monitoring the rate of emergence and the time it takes for the canopy to develop. If done regularly it can then be fed into a potato yield monitor.
Hummingbird can also help with desiccation — they can look at how much green material is left in the canopy to help farmers develop a spot spraying or variable rate application plan.
“This is all about managing the canopy. Trying to get an even canopy and making sure you’re not over fertilizing the crop — which means it’s going to stay green for too long and then you’re having to spend a lot of money trying to kill it,” says Goulding.
Another less used Hummingbird product for potato growers is weed detection, Goulding says. Once the crop has emerged, they can take an image of the crop and mask out the crop, leaving only the weeds and then create a variable rate herbicide plan to spray for.
Growers in the UK using Hummingbird’s potato products have found they’re able to be more targeted with their crop inputs, saving themselves time and money.
“Having remote data to support them in their field scouting and making sure they’re not missing any problems — there’s significant value in that,” Goulding says, adding growers have found they’re able to keep easier track of diseases in their crops.
Not Just for Growers
Hummingbird doesn’t just provide information to growers — they also work with processors who use them for regional yield prediction.
“In other words, how are my growers’ crops… am I going to have enough raw material coming into my factory? That’s all they want to know really at the end of the day,” Goulding says.
Hummingbird has yet to sign any contracts with processors for yield monitoring in Canada, but they are working on it. Globally they work with PepsiCo in Brazil and Australia, and Lamb Weston in the UK.
By identifying and localising crops growing in fields, we can inform supply chains about food production months before harvest.
Introduction
The COVID-19 pandemic has highlighted the increasing demand for regular monitoring of agricultural production as a vital instrument to ensure food security and to avoid potential shortages in the food supply chain. Our in-house near-real-time crop identification algorithm helps monitor agricultural activity during the season at a lower operational cost. The exceptional accuracy achieved through the use of satellite data reaches at a level higher than 90% one to two months prior to harvest. Near-real-time identification of crops growing over large areas is also a stepping stone to yield prediction, which would give full visibility on the expected agricultural production at a much earlier stage than it is currently possible and detect anomalies in region-scale agricultural production.
“Hummingbird Technologies is an Artificial Intelligence business that provides advanced crop analytics to its customers by using proprietary Machine Learning algorithms applied to remote sensing captured imagery.
Our expertise allows our customers: to increase their yields, optimise chemical inputs, farm more sustainably and make earlier, more informed decisions.
By pushing the boundaries of science and technology, our mission is to improve the efficiency of global crop production, and to feed the world’s growing population sustainably.”
Will Wells, Hummingbird Technologies’s CEO
Our approach
Remote sensing using satellites has proven to be an invaluable tool for accurate crop mapping across the world. The most conventional way of performing satellite-based crop classifications is based on multi-temporal observations. They have been found to be more effective than a single observation in classifying agricultural fields due to their ability to capture multiple growth stages and varying types of crop structure, allowing for better differentiation between individual crops. Examples of such approaches can be found in the links below [1][2]. However, most of these approaches use the full volume of data for the whole season to make an estimation after the season has ended. Even though such an approach would maximise the accuracy it is not very useful in practice. After the season has ended all the decisions have been made and a crop inventory would have a lot more than archiving value.
Instead, the technique that we developed combines the best of both worlds by (a) using time-series to benefit from crop variation over time (b) being capable to predict crop types as early as mid-season, enabling live forecasting of crop production. This tool, which allows more informed decisions weeks to months before harvest, has been built combining Synthetic Aperture Radar (SAR) data and AI.
Why SAR?
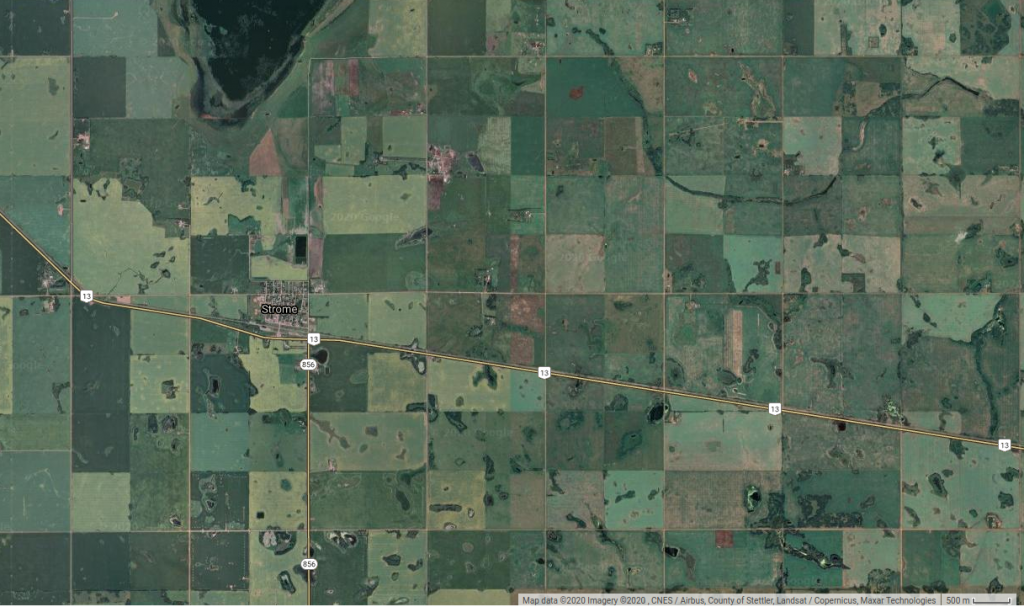
When referring to satellite data, most people envision a typical image provided by GIS applications such as Google Maps (Fig.1). (Optical) images are far from being the only data modality captured from Earth Observation satellites. The list includes infrared images, hyperspectral imagery, LiDAR and SAR.
The farming community is familiar with data that go beyond the commonly used optical images. As a matter of fact, the most common proxy used in agricultural data science is the normalized difference vegetation index (NDVI). NDVI, a synthetic band that combines optical with infrared information, is known to be associated with vegetation health and is widely used to determine management areas for variable rate application of crop inputs [3].
However, both optical and infrared sensors suffer from a common issue in Earth Observation, clouds. Both of them can’t penetrate clouds, hence, any scene that is covered by clouds can not be directly observed during that time. The unpredictability of cloud formation in the atmosphere, as well as the extent (both in space and in time) of cloud cover, imposes severe challenges in their use for this task. A time-series approach would ideally require data acquired in regular intervals or at least a substantial number of cloudless entries. This parameter makes such a tool fully ad-hoc, with an accuracy depending on the geographic location, as well as depending on processes in the atmosphere that can not be controlled and is extremely hard to predict.
In Hummingbird Technologies we have developed a tool with a consistent performance across all geographies and without dependencies from the weather conditions. The solution was using SAR. SAR is a completely different way to generate a picture by actively illuminating the ground using microwaves rather than utilizing the light from the sun as with optical images. Most importantly, SAR penetrates the clouds, it does not depend on weather conditions, it can even capture ‘’images’’ at night (Fig.2)[4]. Therefore, using SAR can make sure that we get data in a regular interval, thus creating a time-series that doesn’t require interpolation or any other tedious and error-prone processing for missing data.
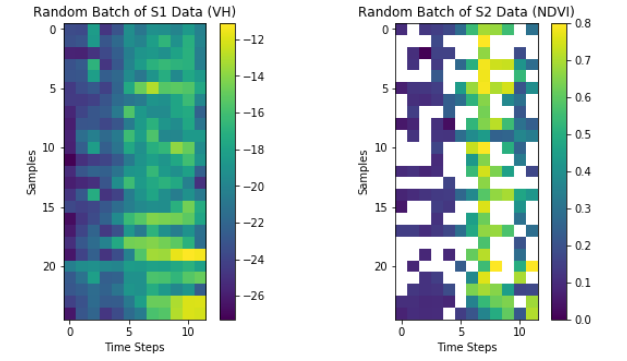
Figure 2 compares the data availability of Sentinel 1 and Sentinel 2. Both Sentinel satellites have been launched from ESA and provide open-source Earth Observation data. The main difference between them is that Sentinel 1 is SAR when Sentinel 2 is optical and infrared. In Figure 2, each column represents a 10-day time period while each row represents one field. The colours quantify two agriculture-relevant data proxies, VH backscatter (in the case of Sentinel 1) and NDVI (in the case of Sentinel 2), while a cell is blank when the data are missing due to clouds. There are two conclusions from this figure. Firstly, Sentinel 2 data is missed over large periods of times, in some cases, months. Secondly, there seems to be a correlation between the proxies estimated from each of the instruments. The conclusion is that using SAR we can get meaningful data, additionally, at regular intervals.
The main reason for getting useful information from SAR is that backscatter is affected most by canopy structure and by other things like vegetation moisture content, wind altering the canopy structure, as well as the properties of the underlying soil [5]. Despite the steep learning curve of SAR, we strongly believe that it constitutes a valuable source of information, which can be much more extensively used in agriculture applications (current SAR applications include ship tracking, disaster detection and ice monitoring), especially ones that would benefit from undisturbed monitoring for large periods of time.
Before we move to a demonstration of this technology at a large scale we should give some practical information about the data used in this analysis. The source of SAR data was Sentinel-1, an ESA instrument which has operated since 2014 and generates open source SAR information in a six-day repeat cycle at the Equator and even more often in higher latitudes. Sentinel-1 GSD is 10 metres per ”pixel”, while pre-processing and denoising of the input was done using Snap open-source toolkit [6]. Figure 3 gives an artistic representation of Sentinel 1 monitoring Earth.
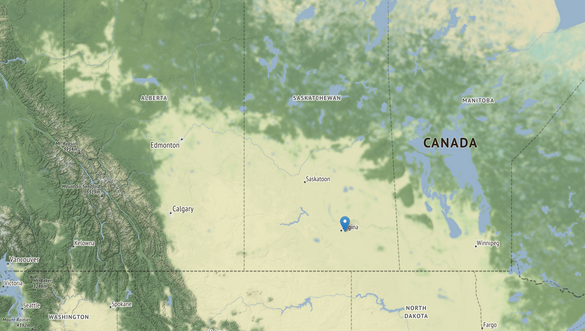
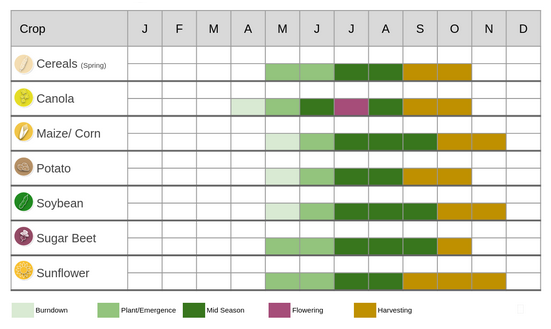
A pilot study area was selected in the Canadian region of prairies (Fig.4). This is the main agricultural region of Canada, including more than 90% of the total Canadian arable lands, and having a total area of approximately 437 thousand square kilometres. The main crops of Canada are cereals, grasslands, oilseeds, corn (maize) and pulses (e.g. peas, lentils, beans)[7]. The growing season is relatively short, lasting from May to September (Fig.5). This imposes an additional challenge on an automated crop type classification solution by limiting the number of available data points for each field. On the other hand, usually, one crop is grown in each field, hence, there is no need to differentiate between crops growing in the same field.
Ground-Truth Labels
Similar to other countries across the globe Canada keeps an inventory covering all major crops on a per-field basis. This archive is updated six months after the end of every season and is released from Agriculture and Agri-Food Canada as a map with a spatial resolution of 30m. More information for Canada’s Annual Crop Inventory can be found in the following links [8][9].
To train, as well as validate and test, our solution, we have downloaded 60,000 field boundaries and crop types for the seasons between 2017 and 2019. The number of fields was selected to generate a dataset with a large number of samples for each one of the main crop types. Moreover, in order to avoid overfitting to the (meteorological, agronomical, etc.) conditions of a specific region in Canada the samples were randomly selected from the whole examined area.
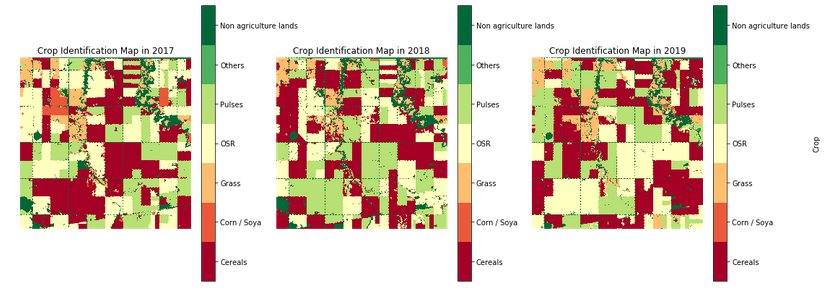
Figure 6: Crop mapping from 2017 to 2019 near Regina, Saskatchewan provided by the Canadian government
The objective of this study was to confirm that we can automatically generate crop labels for such a large area throughout the growing season (i.e. 7–8 months before the official release) with a high enough accuracy to be useful for downstream commercial applications. Additional goals include identifying the inherent limitations of such a technology, as well as detecting and removing the challenges that hinder its systematic use in a commercial context.
Unique backscatter signatures for each crop
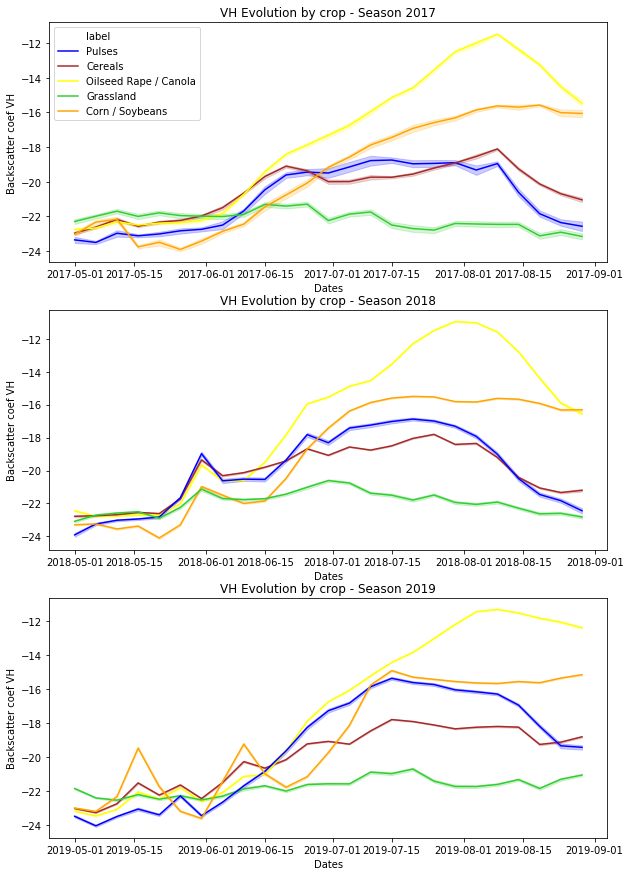
The main hypothesis in this work is that each crop would be associated with a unique (but constant across different seasons) backscatter-vs-time signature, which can be used to differentiate them through a machine learning architecture. This was examined by averaging the SAR backscatter for each crop, and plotting it for 2017, 2018 and 2019 seasons (Figure 7).
It is apparent in Figure 7 that both parts of our hypothesis are valid. Firstly, after a brief period of time in which the backscatter differences are inconclusive, crops, one after another, follow a unique trajectory which renders them identifiable. More specifically, grassland seems to exhibit a quite constant backscattering across the season, something that makes it distinguishable from any other crop type. On the other edge, Canola tends to have the highest increase over the season, which is only reversed a few weeks before harvest. This decrease is also apparent in pulses and cereals while soybean and corn exhibit an S-shape signature with two rather constant zones that are separated over a period of increase. Perhaps most important is the rather small seasonal variation. SAR signatures show consistent and distinct behaviours for every crop type despite varying farm management practices and meteorological conditions in different seasons. These are not random variations of an uncorrelated variable but constitute a unique signature that can be detected.
Figure 7: Evolution of the VH Backscatter (dB) by crop and season
How early?
Achieving near-real-time crop identification does not depend only on the information content of the employed input data but also on when the corresponding time-series start to differentiate from one another. Figure 7 gives some clues on the approximate time that the differences become apparent. By placing our hands in the right edge of Figure 7 and moving to the left it can be concluded that at least one month of observations can be ignored without crops losing their unique signatures. On the other hand, any time earlier than June (i.e. 3 months before harvest) the crop curves appear to be dominated by noise, with only small (and possibly random) differences between them. This time window of 1–3 months before harvest is the range on which SAR can lead to the development of practical applications of near-real-time crop identification.
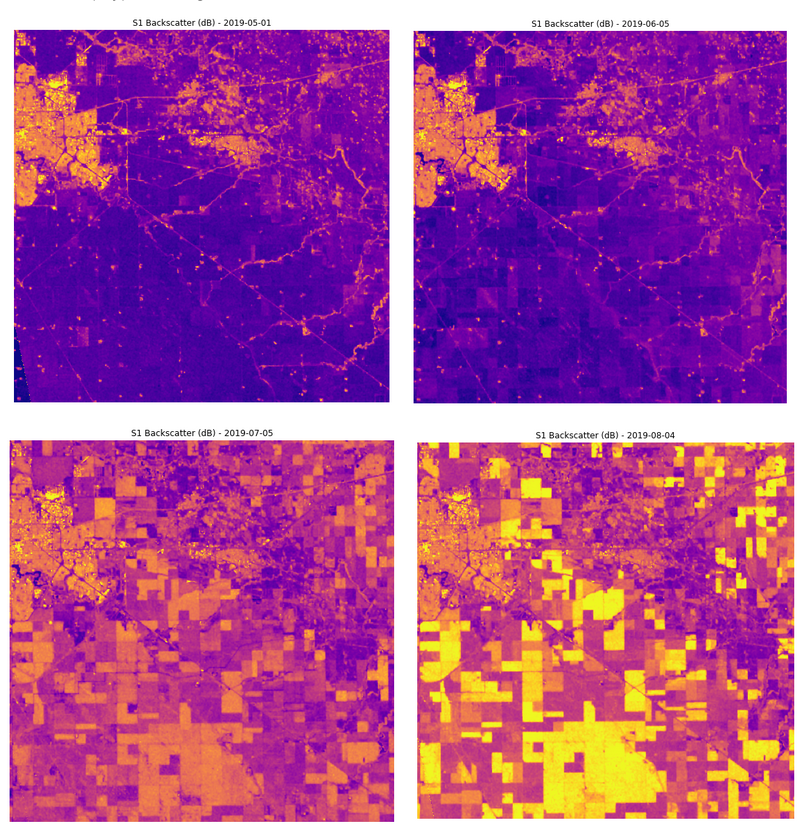
To show an example of how SAR backscatter changes over time, we have analysed the monthly backscatter of a region (close to the city of Regina, which is in the top-left corner of Figure 8) with large holdings of agricultural land. The temporal profiles of the SAR backscatter from May to August (4 months to 1 month before harvest) are plotted in Figure 8. It is apparent that as the season progresses the fields start differentiating and look more distinct starting from July, i.e. during mid-season (two bottom panels of Figure 8). On the other hand, the differences between 4 and 3 months before harvest are so minute that are hard to distinguish with the naked eye.
Figure 8: Monthly VH Backscatter (dB)
A possible explanation of this SAR property is its correlation to the 3D plant structure. SAR interacts with the full canopy, therefore it is associated with the crop height, the canopy density and the leaf structure. On the other hand, at emergence (when the plants are small) SAR is mainly affected by the soil moisture, which even though it is loosely connected to the crop type it does not hold enough information to make the different crop types distinguishable.
Deep Learning Model
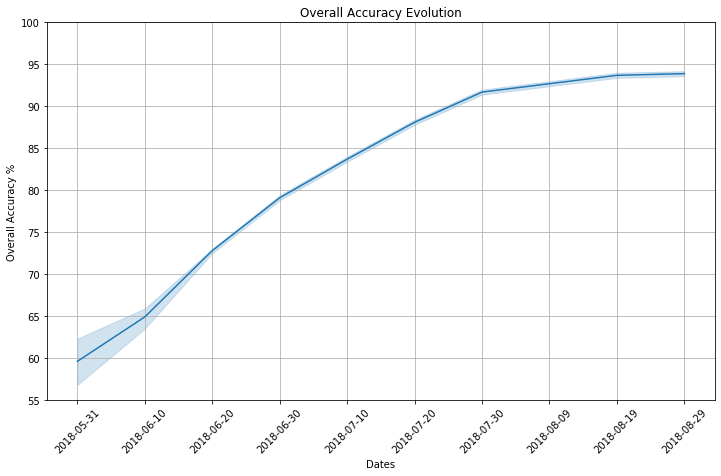
The time-series of SAR data have been the input of a deep learning prototype which was built following the recurrent neural networks (RNN) architecture. RNNs are commonly used to analyse sequential or time-series data and were therefore used as a base layer for the network [10]. A double input model was built combining both Sentinel-1 time-series with optional crop rotation information. Crop rotation information is highly relevant because farmers tend to rotate their crops following a few standard agronomical practices to increase yield potential. Using custom data augmentation and a bespoke architecture we have developed a model that generates predictions at any point during the season. This was tested in weekly intervals for the period between the end of May and end of August. The results are summarised in Figure 9.
The first conclusion of Figure 9 is the confirmation that the last month before harvest can be omitted without any significant loss of accuracy. The performance saturates to 92% around the end of July (6 weeks before harvest), afterwards the improvement is minor, reaching 94% by the end of August. For most practical applications of this technology the accuracy reached by the end of July (or even a few weeks before that) would be enough to generate accurate representations of crop mapping, therefore the improvements over the last month have a little bit more than academic interest. On the other hand, the almost perfectly linear performance gain for the period before indicates the gradual differentiation between crops, which start 3–4 months before harvest and consistently increases over time. One of our main objectives over the next period is to push the boundaries, trying to flatten this part of the curve as much as possible.
Figure 9: Overall accuracy of the real-time classification simulation with 95% confidence intervals.
The end result of this technology is crop monitoring maps over large areas. Hummingbird technologies currently provide customers crop type classification maps at a 30 metres resolution, in two setups, (a) one month before harvest and (b) two months before harvest. An example of such a map (in this case, updated every 10 days for demo reasons) is presented in Figure 10. These maps can be delivered both in season across any geography for which ground truth labels are available. We are currently working on a global solution which would use information from multiple geographies to provide an accurate assessment of crops growing in large parts of the world, having as a target to be able to generate a near-real-time worldwide crop map over the near future.
Figure 10: Evolving crop map from June to August 2019 in an area of interest in Saskatchewan, Canada. The map is refreshed every 10 days through the growing season
References
[1] Rußwurm, Marc & Körner, Marco. (2017). MULTI-TEMPORAL LAND COVER CLASSIFICATION WITH LONG SHORT-TERM MEMORY NEURAL NETWORKS. ISPRS — International Archives of the Photogrammetry, Remote Sensing and Spatial Information Sciences. XLII-1/W1. 551–558. 10.5194/isprs-archives-XLII-1-W1–551–2017.
[2] Tracy Whelen & Paul Siqueira (2018) Time-series classification of Sentinel-1 agricultural data over North Dakota, Remote Sensing Letters, 9:5, 411–420, DOI: 10.1080/2150704X.2018.1430393
[3] Lee, W., & Searcy, S. (2000, July). Multispectral sensor for detecting nitrogen in corn plants. In ASAE Annual International Meeting, Midwest Express Center, Milwaukee, Wisconsin (pp. 9–12).
[8]T. Fisette et al., “AAFC annual crop inventory,” 2013 Second International Conference on Agro-Geoinformatics (Agro-Geoinformatics), Fairfax, VA, 2013, pp. 270–274, doi: 10.1109/Argo-Geoinformatics.2013.6621920.
[10] Ndikumana, E., Ho Tong Minh, D., Baghdadi, N., Courault, D., & Hossard, L. (2018). Deep recurrent neural network for agricultural classification using multitemporal SAR Sentinel-1 for Camargue, France. Remote Sensing, 10(8), 1217.
Article originally posted on medium.com – VIEW HERE
We use cookies on our website to give you the most relevant experience by remembering your preferences and repeat visits. By clicking “Accept”, you consent to the use of these cookies. View our privacy policy
This website uses cookies to improve your experience while you navigate through the website. Out of these, the cookies that are categorized as necessary are stored on your browser as they are essential for the working of basic functionalities of the website. We also use third-party cookies that help us analyze and understand how you use this website. These cookies will be stored in your browser only with your consent. You also have the option to opt-out of these cookies. But opting out of some of these cookies may affect your browsing experience.
Necessary cookies are absolutely essential for the website to function properly. These cookies ensure basic functionalities and security features of the website, anonymously.
Cookie
Duration
Description
cookielawinfo-checbox-analytics
11 months
This cookie is set by GDPR Cookie Consent plugin. The cookie is used to store the user consent for the cookies in the category "Analytics".
cookielawinfo-checbox-functional
11 months
The cookie is set by GDPR cookie consent to record the user consent for the cookies in the category "Functional".
cookielawinfo-checbox-others
11 months
This cookie is set by GDPR Cookie Consent plugin. The cookie is used to store the user consent for the cookies in the category "Other.
cookielawinfo-checkbox-necessary
11 months
This cookie is set by GDPR Cookie Consent plugin. The cookies is used to store the user consent for the cookies in the category "Necessary".
cookielawinfo-checkbox-performance
11 months
This cookie is set by GDPR Cookie Consent plugin. The cookie is used to store the user consent for the cookies in the category "Performance".
viewed_cookie_policy
11 months
The cookie is set by the GDPR Cookie Consent plugin and is used to store whether or not user has consented to the use of cookies. It does not store any personal data.
Functional cookies help to perform certain functionalities like sharing the content of the website on social media platforms, collect feedbacks, and other third-party features.
Performance cookies are used to understand and analyze the key performance indexes of the website which helps in delivering a better user experience for the visitors.
Analytical cookies are used to understand how visitors interact with the website. These cookies help provide information on metrics the number of visitors, bounce rate, traffic source, etc.
Advertisement cookies are used to provide visitors with relevant ads and marketing campaigns. These cookies track visitors across websites and collect information to provide customized ads.